Google is regularly improving its search algorithms to improve the quality of SERPs. The latest major update from the Google team focuses on Core Web Vitals, a set of performance metrics for assessing the user experience that will become a page ranking signal starting mid-June 2021. Cumulative Layout Shift (CLS) - is a Core Web Vitals performance metric for measuring visual stability, detecting unexpected layout shifts that affect how users interact with the webpage.
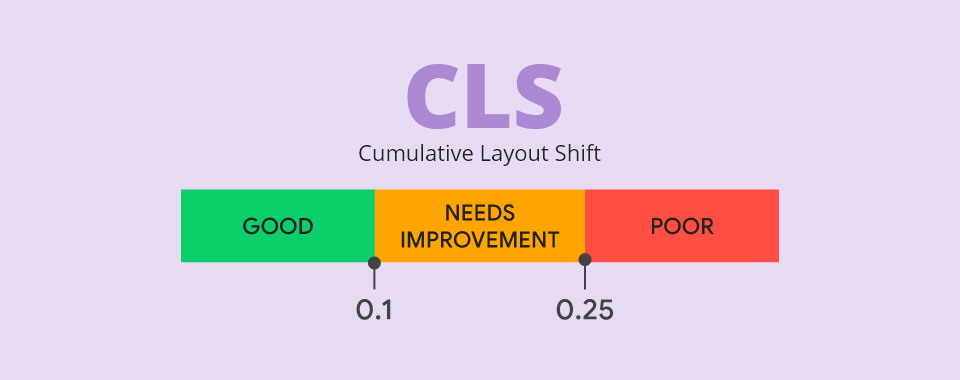
The CLS metric is calculated as the sum of all individual unexpected layout shifts between the two rendered frames. In a nutshell, CLS shows how visually stable your website is during its entire lifespan. You can get your website's score via PageSpeed Insights, Google Search Console, or Lighthouse. Your goal should be to keep the CLS score under 0.1 on all pages across desktop and mobile devices.
What if you're not happy with your CLS score and want to optimize your page? Debugging and fixing the cumulative layout shift issue can be a challenge.
Things to Keep in Mind Before Debugging CLS
- CLS reports and insights can be obtained synthetically - lab data or via real-user monitoring (RUM) - field data. Lab measurements run page loads on simulated devices and networks. Contrarily, RUM reflects the real-user experience during the entire lifespan of the session, with reports available in Google Search Console or CrUX. Consequently, the lab and field data can differ significantly.
- Field data collected by Google via Chrome is the only source used as a Page Experience ranking signal. We should rely only on Search Console field data for the possible ranking boost.
- CLS measurement is not just focused on page load, as problematic shifts could happen anytime during the page lifecycle if DOM elements get dynamically updated or injected into the layout. CLS is accumulated until the unload event.
- Layout shifts can depend on viewport size (and are usually more severe on mobile screens), so make sure to measure on a few different devices.
- The debugging tools will show the DOM element that experiences a layout shift, which is not necessarily the element that is causing it. Multiple elements can shift because of a single culprit.
- The Input exclusion window ignores layout shifts happening within 500ms after user interaction (
mousedown,keydown, andpointerdownevents) - they will not be included in the overall CLS score. On the other hand, this means that even the expected content movement will be counted in your CLS score if not done within 500ms.
How to Identify Elements Causing CLS
To fix the cumulative layout shifts, we must first diagnose and debug which elements are causing it. Some reports like CrUX are providing high-level info on Core Web Vitals and are unable to give us detailed debug data. There are multiple lab and field measurement tools we can combine to get more insights. Without field data, it's impossible to know whether the changes we're making improve the actual user experience, while lab data provides reproducible results in a debugging environment.
Need help improving your Core Web Vitals?
Be ready for the new Google page ranking signals. Let us debug & optimize your Core Web Vitals & protect your SERP position!
CLS Lab Debugging
Chrome DevTools
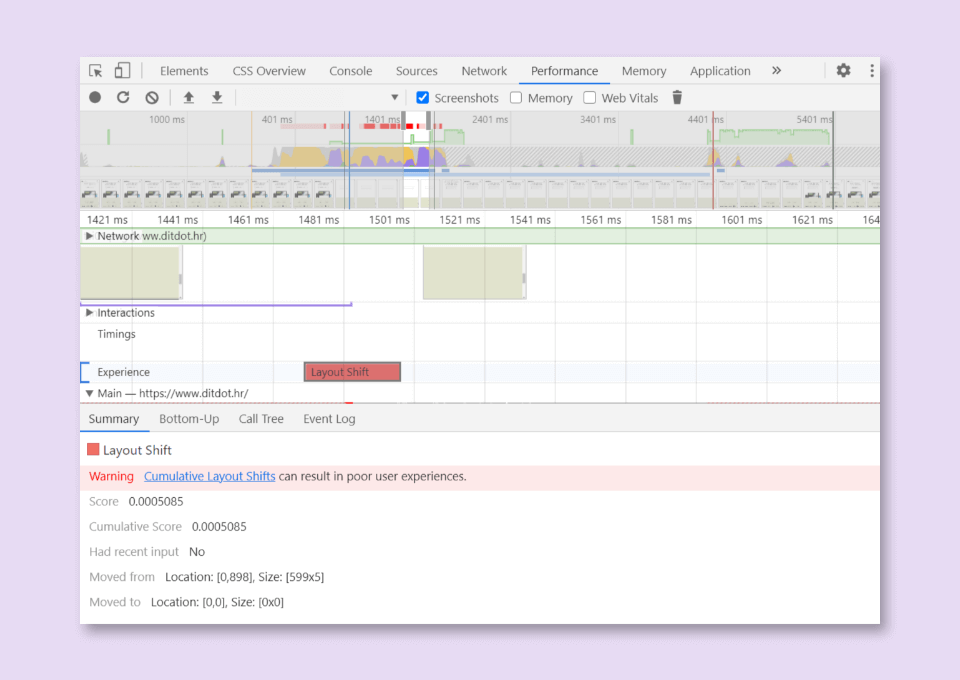
In the Performance tab, Chrome builds a performance profile for the page runtime, including the Core Web Vitals metrics.
- Click the 'Start profiling' and reload the page. The performance report is generated for the time before you pressed the stop button.
- Find the Layout Shift on the timing graph.
- Click the Layout Shift event to see the details of the layout shift in the Summary tab. Hover over the Moved from and Moved to fields to visualize the layout shift.
Another way to detect layout shifting in DevTools:
- Open the Customize and control DevTools menu
- More Tools -> Rendering
- Enable the "Layout Shift Regions" checkbox. Unexpected cumulative layout shifts will be highlighted in blue as you interact with a page
Lighthouse
Lighthouse report provides essential lab information on Core Web Vitals, including the DOM elements contributing the most to the CLS of the page. Lighthouse is integrated into the Chrome DevTools, under the "Lighthouse" tab. Lighthouse is also used by PageSpeed Insights to generate the page's performance score.
How to interpret the Lighthouse CLS audit results?
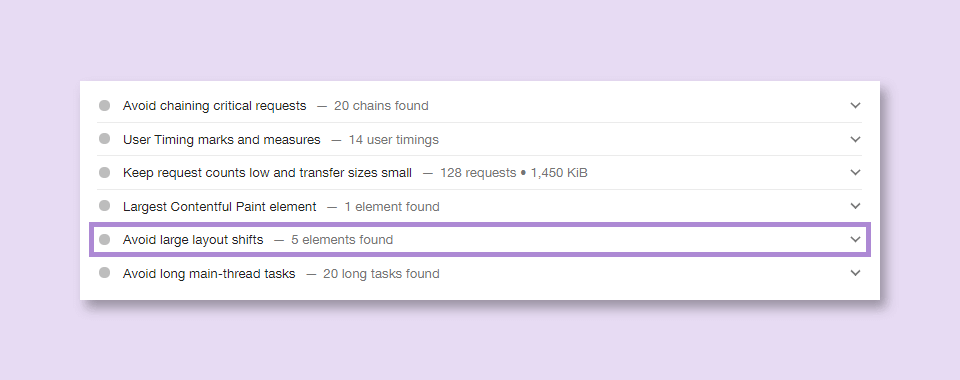
Once the Lighthouse or PageSpeed Insights report is ready, you might see the “Avoid large layout shifts” warning. When you click on it, the following will be displayed: These DOM elements contribute most to the CLS of the page with DOM elements that have shifted listed below and highlighted so you could easily find them on the page.
DOM elements are HTML elements representing parts of the webpage like images, headings, and paragraphs. The warning is showing which elements are reporting the CLS so you can address the problem.
Some hints can be given by element type and its CLS contribution. If a text element shifts by a small amount, the shift is probably caused by the web font loading. However, if the start position of some element changes significantly, the problem may be caused by inserting some content like ads, cookie consents and banners into the DOM or simply by images without size attributes.
As already mentioned above, be aware that the elements that shift are not necessarily causing the shift. Another element could cause the reported shift of an element.
Chrome Extensions
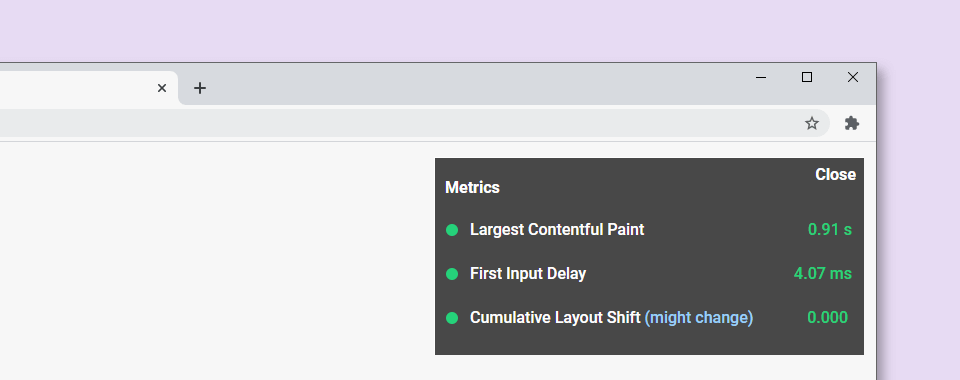
Chrome Web Vitals and similar extensions will display all three Core Web Vitals metrics - LCP, FID, and CLS. Web Vitals extension shows us the individual metric values and logs Layout Shift objects to the console. You can see the CLS values change in real-time on the extensions Heads-up display (HUD) as you scroll and interact with the page.
CLS Field Debugging
JavaScript API
One possible way to get RUM web performance data from the user is to use the Performance Observer API. PerformanceObserver allows us to subscribe passively to performance-related events. When we create a new PerformanceObserver, we tell it to look for a specific event during a website's visitors session. Whenever this event happens, we can capture it and get the information on CLS sources programmatically.
Layout shift events are captured using the Layout Instability API. This experimental API reports individual layout-shift occurrences to the PerformanceObserver registered on the page. We can send the result to the web server or Google Analytics once the page's lifecycle state becomes hidden.
let cls = 0;
new PerformanceObserver((entryList) => {
  for (const entry of entryList.getEntries()) {
    // 500 ms input exclusion window
    if (!entry.hadRecentInput) {
      cls += entry.value;
      console.log('Current CLS value:', cls, entry);
    }
  }
// the buffered flag enables observer to access entries from before the observer creation
}).observe({type: 'layout-shift', buffered: true});
This approach gives us the flexibility to tweak this basic code when debugging, e.g., we can report or track only the five largest layout shift sources or tracking the score for each SPA route separately.
web-vitals Library
We can collect Core Web Vitals scores from field data with the web-vitals library. web-vitals is usually used to report the CLS metric once it is ready to be reported - when the page starts to unload. For debugging purposes, it is possible to make a more fine-grained analysis, e.g., to report each layout shift as it happens by setting the second argument in the getCLS function to true.
import {getCLS} from 'web-vitals';

// Logs CLS as the value changes.
getCLS(console.log, true);
To create custom visualizations of the data for any website that uses the web-vitals library sending data to Google Analytics, we can use Web Vitals Report web app.
Optimizing Cumulative Layout Shift (CLS)
After collecting the metrics data and understanding the problem, we can start with actual performance optimization and reduce the CLS. We should improve the most important elements/pages on the website first and track how the improvements affect the score.
Font Loading and Text Rendering Strategy
Common reasons for layout shifts are the shifting of text elements. Upon load completion, the fallback font is replaced with the web font and as a result, the text is re-rendered with the intended font. Web font loading often causes misalignment of layout elements, e.g., if text rendered with the fallback font is one line shorter than the one rendered with the web font.
This can be avoided by defining a different text rendering strategy with the CSS descriptor font-display. For example setting the font-display to optional within an at-rule means that: if the primary font does not load in the first 100ms, the text is rendered using the fallback font. However, the next time you visit the page the web font will be used if loaded successfully. This strategy allows us to minimize repaints and CLS.
We can combine font-display: optional with <link rel="preload"> to preload optional fonts and completely eliminate layout shifting. Read more about it in the Preload Optional Fonts article on web.dev.
If you prefer font-display: swap or any other value except optional, try using some of the font style matching tools like Font Style Matcher or check this list - Metric Compatible Fonts. You can minimize the discrepancy between the fonts by choosing ones with similar x-heights and widths.
Optimizing Animations
Non-composite animations trigger layout recalculation and can negatively affect the final CLS score. On the other side, composite animations using properties like transform and opacity do not cause such recalculations. It makes them faster, more performant, and more user-friendly.
Apparently, the eased animations produce larger layout shifts than linear ones - check this and some other interesting CLS tests.
On our company's website landing page, we are using an autoplay image carousel to slide a couple of decorative images. Before optimization, the carousel was animated using the position offset property:
left: -(slide_number * 100) + 'vw';This approach reruns the layout engine on every animation frame producing a layout shift with every slide change. Individual shift score wasn't a large one, but the cumulative layout shift grew indefinitely, proportional to how long the user stays on the page.
A solution to the problem was to create the animation using the transform property instead of the position offset. After applying this code, the slider wasn't causing any further layout shifts:
transform: 'translate3d(' + -slide_number * 100 + 'vw, 0, 0)';
translate3d is used to force hardware acceleration and promote animated elements to their own layer.
Enforce Scrollbar Appearance
Some OS (like Windows) use non-overlay scrollbars. These scrollbars are added after the First Paint, during the page load and can cause page content to shift e.g. when injecting additional content with JavaScript. You can add the following rule to force the scrollbar appearance:
html { overflow-y: scroll }This should force the scrollbar to show all the time, preventing horizontal layout shift. When not needed, the scrollbar will be grayed out but will keep its width. Note: You should consider this technique only on pages that require this fix to reduce the CLS.
Use the 500ms Window for User Interaction
...especially for asynchronous actions (waiting for a response before updating DOM).
Load more and Infinite scroll are just two examples of interaction patterns where the response time should be kept under the 500ms Input exclusion window. Otherwise, as the page content gets shifted by the dynamically injected content (the footer in this particular case), the shifts will increase the CLS score. Prefetch the content to load it fast and use placeholders/skeleton while the data is being requested. Read about the possible solutions in Addy Osmani’s article - Infinite Scroll Without Layout Shifts.
Content dynamically injected with JavaScript
Dynamically injected content refers to the DOM elements that get added dynamically above existing content. These can be banners, ads with dynamic sizing, cookie consent popups, iframes, widgets that dynamically resize (like chat windows) or any kind of content inserted after the initial page load.
Possible solutions:
- Avoid using JavaScript to style or generate content wherever possible.
- Overlay small dynamic content, e.g. with absolute positioning properties, to cover the existing elements instead of shifting them.
- For larger elements, reserve space on the page in advance - for example, show them out of the main content flow (in the sidebar) or use the skeleton/placeholder strategy.
- If possible, add dimensions to iframes and other elements with dynamic content.
- Optimize loading strategy for late-discovered scripts that populate components with content. Defer the scripts used to add elements above the fold that will likely cause layout shift.
Add Size Attributes to Images and Video
Size attributes are the low-hanging fruit of CLS optimization. Always include width and height size attributes on your images and video elements to ensure sufficient space is allocated on the page before the browser started fetching them.
<img src="example.jpg" width="360" height="180" alt="example">Conclusion
Understanding, debugging, and improving CLS is an excellent step towards targeted page optimization, especially when combined with other web performance metrics. The transparency of CLS criteria and debugging tools help developers make informed decisions about implementing layouts, user-flows and optimizing pages to satisfy both the user and Google's page ranking systems.